A powerful combination for the semi-automatic generation of insights
A Knowledge Graph is a set of datapoints linked by relations that describe a domain, for instance a business, an organization, or a field of study. It is a powerful way of representing data because Knowledge Graphs can be built automatically and can then be explored to reveal new insights about the domain.
Knowledge Graphs are secondary or derivate datasets: They are obtained by analyzing and filtering the original data. More specifically, the relations between data points are pre-calculated and become an important part of the dataset. This means that not only each data point can be analyzed fast and at scale, but also each relation.
The choice of how to describe the relations and the ability to analyse fast and at scale is the key to new insights. From data to information, from information to knowledge, from knowledge to insight, from insight to wisdom.
For instance, while a geographical map contains the names and coordinates of cities, a simple Knowledge Graph would also include the distance between them. Hence, instead of having to calculate all distances when a query is made, I can immediately ask: what is the shortest route between point A and point R? Pre-calculating the distances is a simple step, but makes the geographical analysis much faster, allowing also to easily test different scenarios. For instance, what’s the shortest route between A and R, knowing that point B is suddenly unreachable?
Graphs as analysis tools have been around for centuries, but only more recently the concept of “Knowledge Graph” has emerged. Its formal definition is given by Paulheim (2016), in which a Knowledge Graph:
- describes real-world entities and their interrelations;
- defines possible classes and relations of entities in a schema;
- allows for potentially interrelating arbitrary entities with each other;
- covers various topics.
Beyond the definition, Knowledge Graph has great marketing appeal: it implies a technological artifact that encapsulates all relations of a company or another domain, leading to a better understanding. And that is becoming more and more true, also thanks to Machine Learning.
Describing new relations using Machine Learning
The workhorse of the Machine Learning revolution is data classification by means of Deep Learning. By classifying data, we create subsets of data points that are related by belonging to the same class. This relation didn’t exist before the classification and can now be used to create a Knowledge Graph.
The power of Deep Learning is to be able to classify complex data without providing explicit description but simply examples. Images, speech, documents, spreadsheets, presentations, videos,… Deep Learning can classify a lot of different kinds of data, giving an unprecedented opportunity to describe a domain from multiple perspectives. Describing millions of data points by hand is largely not viable. Imagine having to read and classify millions of precise but dry legal documents. Not the best use of human time.
Making most of one’s time is also one simple example of ML-generated Knowledge Graph for a company: by analyzing documents it is possible to know that both the A-team and team ∆ are separately working on the same subject, giving the opportunity to improve the collaboration.
There are many possible use cases for the powerful combination of graphs and ML. The development requires working on two challenging aspects: access to data and finding the classes that will lead to the desired outcome. While the first is mostly an organizational, legal, and often ethical issue, the second requires domain knowledge. While before the ML-revolution this was typically only provided by subject-matter experts, now ML systems can support this work, reducing the barrier to entry.
ML also supports the definition of the classes of relations
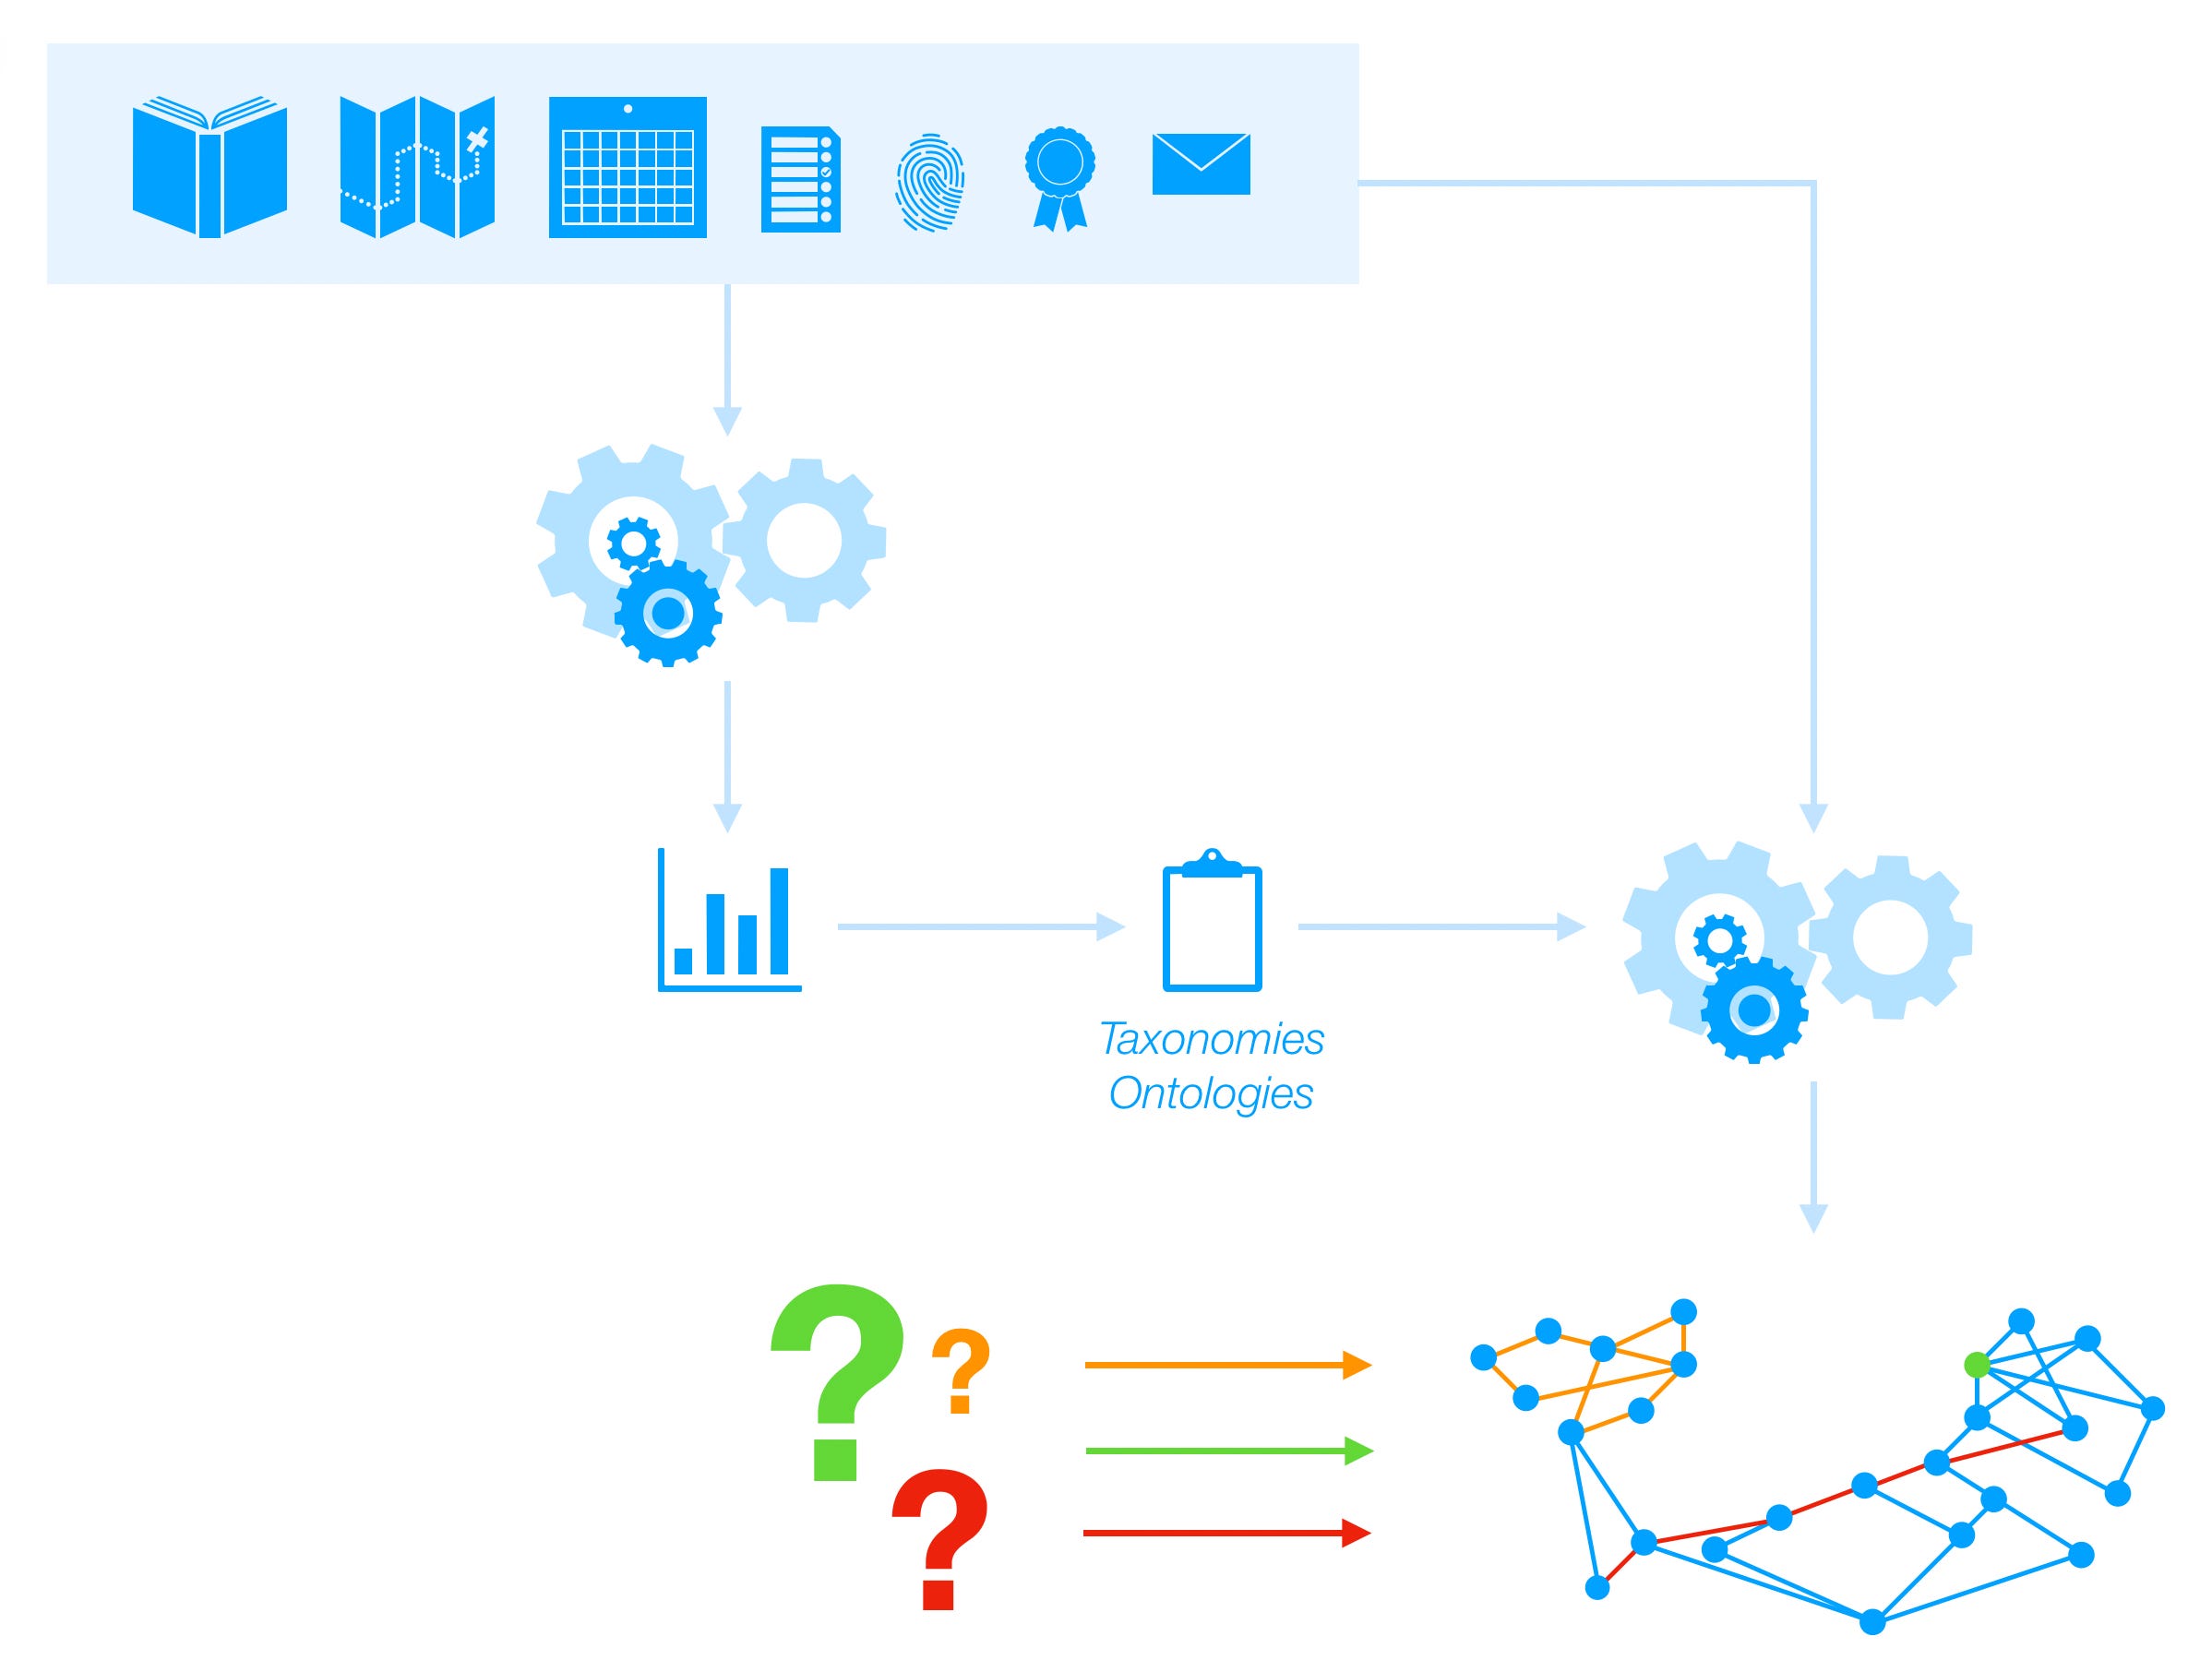
Machine Learning can support the creation of relations using classification, but also the definition of the classes. For instance, Natural Language Processing of documents can model topics and recognize named-entities. With their statistical representation, a human can then make data-informed decisions about which elements should constitute new types of relations. These then become the labels for the classification.

This means that to create a Knowledge Graph, any database that might contain relevant information is crawled and scanned. Files, directories, activity logs,… anything can be statistically analyzed to create taxonomies and ontologies, which are the terms used to define the classes, properties, and relations between data points, as well as how new are created. They are the blueprint and instructions by which all data points considered are classified and described. This is at the core of why Knowledge Graphs are also sometimes called semantic networks. Semantic emphasizes the fact that the meaning is encoded together with the corresponding data. This is done through the taxonomies and ontologies (their general terms have some overlap, partially due to their origin. Taxonomy comes from biology, while ontology has its roots in philosophy — from the Greek Ontologia, “the study of being”. More formal definitions exist, like those used in computer science, but they are not completely relevant in this context).
The human judgement in defining the taxonomy and ontology is important because data could be described in an infinite amount of ways. Machine are still unable to consider the broader context to make the appropriate decisions. The taxonomies and ontologies are like providing a perspective from which to observe and manipulate the data. If the element of interest is not being considered, then the Knowledge Graph won’t provide any insight. Choosing the right perspective is how value is created. Typically this task is carried out iteratively, learning also from what doesn’t work.

Once you have defined the rules, you can apply them to new data, creating metadata and thus the Knowledge Graph. In an appropriate database system, it can then be easily queried and analyzed. For instance, how many relations does a particular entity have? What is the shortest route from A to Z? How similar are the subgraphs?
One of the powers of Knowledge Graphs is also being able to relate different types of data and provenances. This is very useful for extracting value by combining information from different sources, across for instance corporate silos.
Creating a Knowledge Graph is a significant endeavor because it requires access to data, significant domain and Machine Learning expertise, as well as appropriate technical infrastructure. However, once these requirements have been established for one Knowledge Graph, more can be created for further domains and use cases. Given that new insights can be found, Knowledge Graphs are a transformative way of extracting value from existing unstructured data. Use it wisely.


